

Quick answer: Vehicle port congestion is not container congestion. Container backlogs show up at the berth; vehicle backlogs show up downstream in compound capacity and processing throughput, which is why RoRo vessels can discharge on schedule while units still sit. Contingency planning has to target the yard, not the quay.
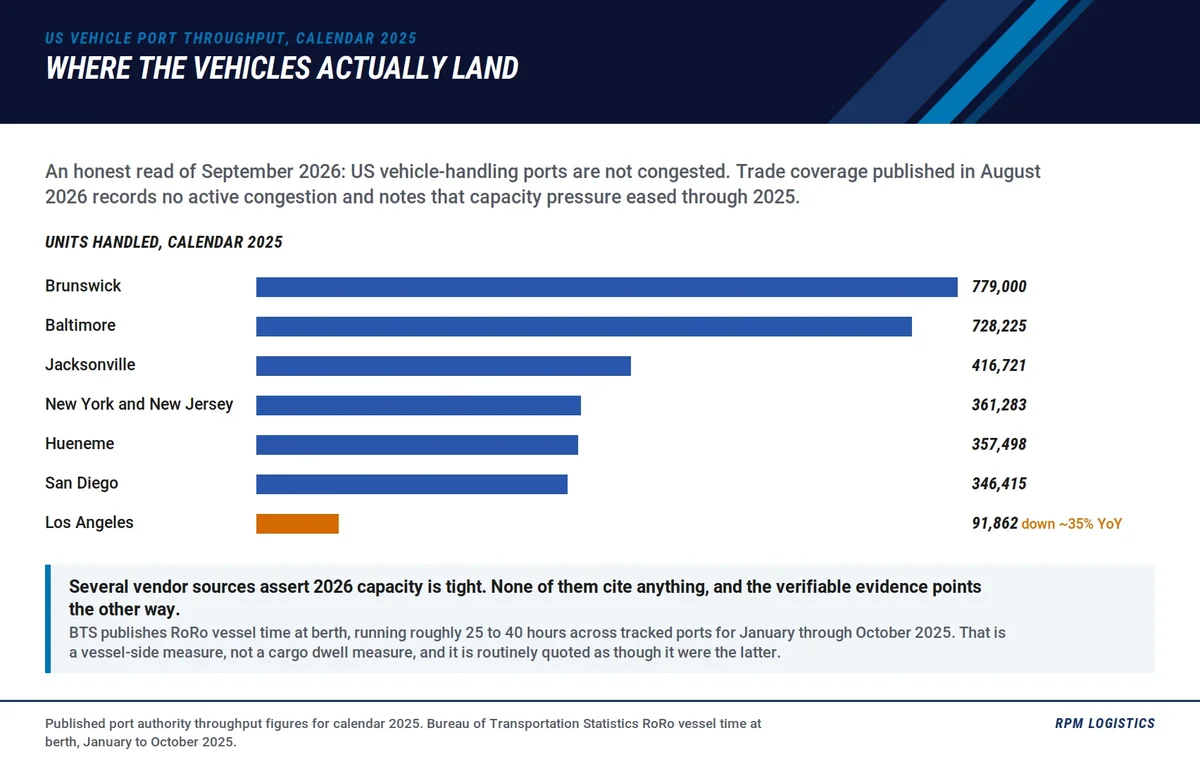
Calendar 2025 units handled. Los Angeles fell about 35% year over year.
Two things make this topic harder than it should be. The first is that most published material on port congestion is about containers, and containers behave differently. The second is that the current environment is not congested, which makes it exactly the right moment to build a plan rather than the wrong one.
This covers where vehicle congestion actually forms, what signals precede it, and what an OEM does about it before dwell shows up in the numbers. For how the normal flow works, start with our guide to port-to-dealer finished vehicle logistics.
Container congestion and vehicle congestion are different problems
This distinction gets collapsed constantly and it leads to the wrong contingency plan.
Container congestion is berth-driven. Vessels queue offshore because there is no berth, cranes are the throughput constraint, and the visible symptom is ships at anchor. The metrics are vessel wait time and terminal box dwell.
Vehicle congestion is yard-driven. RoRo discharge is fast and labour-light by comparison: units drive off. The constraint sits downstream, in compound acreage, processing and pre-delivery inspection throughput, and inland transport capacity to clear the lot. A vehicle terminal can discharge a vessel on schedule and still be gridlocked, because the problem is not getting units off the ship, it is having somewhere to put them and a way to move them out.
The federal data supports the distinction. The Bureau of Transportation Statistics Port Performance Freight Statistics annual report published in January 2026 records RoRo vessel time at berth for January through October 2025 running roughly 25 to 40 hours across tracked ports, with Baltimore highest at around 36 hours average. Those are vessel-side hours, and they are not the problem. The same report publishes no cargo dwell metric at all.
Be careful with dwell figures generally. There is no reliable public figure for finished vehicle cargo dwell at US ports. Neither BTS nor the port authorities publish one, and the leading trade coverage of vehicle dwell argues it is the binding constraint without quantifying it. Anyone citing an industry-standard vehicle dwell number is estimating. Measure your own.
Where the current environment actually sits
An honest read of September 2026: US vehicle-handling ports are not congested. Trade coverage of North American vehicle port operations published in August 2026 records no active congestion and notes that capacity pressure eased through 2025. Building a plan now is cheap. Building one during an event is not.
What is worth knowing about the conditions underneath that calm:
Ocean capacity is loose, not tight. The pure car and truck carrier orderbook has run at roughly 35% of the existing fleet, with around 830 vessels in service and 201 under construction as reported in early 2025, and charter rates have fallen substantially from their 2023 peak of more than $110,000 a day to around $47,500 a day for large PCTCs as of August 2025. That is the most recent publicly verifiable rate print. Several vendor sources assert 2026 capacity is tight; none of them cite anything, and the verifiable evidence points the other way.
Volumes are concentrated. For calendar 2025, Brunswick handled roughly 779,000 units, Baltimore 728,225, Jacksonville 416,721, New York and New Jersey 361,283, Hueneme 357,498 and San Diego 346,415. Los Angeles fell to 91,862, down about 35% year over year. Concentration matters for contingency planning, because the number of ports that can absorb meaningful diverted volume is small.
The 2026 disruption was maritime, not domestic. The Strait of Hormuz crisis that began in late February 2026 and ran through a memorandum ending hostilities in June left roughly a thousand vessels in holding patterns at its April peak, including sixteen car carriers, about 2% of the world PCTC fleet. Congressional Research Service reporting notes that Persian Gulf countries took over 20% of US waterborne passenger car exports in 2025, so the exposure was real and it was on the export side.
Trade policy, stated accurately
This is where most current commentary is wrong, and being right about it is worth more than being detailed about it.
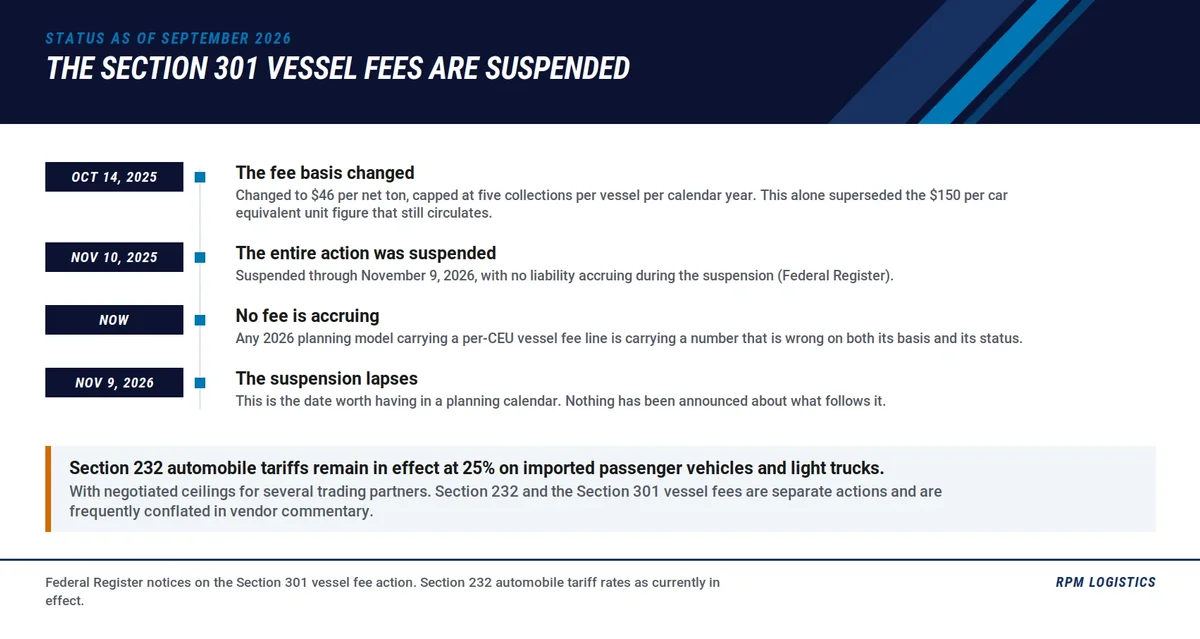
The widely circulated “$150 per car equivalent unit” framing is obsolete twice over.
The Section 301 vessel fees on foreign-built car carriers are currently suspended. The fee basis was changed to $46 per net ton effective October 14, 2025, capped at five collections per vessel per calendar year. The entire action was then suspended from November 10, 2025 through November 9, 2026, with no liability accruing during the suspension (Federal Register).
Two consequences. First, the widely circulated "$150 per car equivalent unit from October 14" framing is obsolete twice over: the basis changed, and then the whole thing was suspended. Trade coverage still ranking on this topic carries the superseded figure. Second, and more usefully, the suspension lapses on November 9, 2026. That is a date to plan against, not a resolved issue.
Section 232 automobile tariffs remain in effect at 25% on imported passenger vehicles and light trucks, with negotiated ceilings for several trading partners. Those rates are reported consistently across trade and legal trackers but were not verified here against the underlying proclamations, so treat specific country rates as directional and check before relying on them commercially.
What precedes a vehicle backlog
The reason congestion surprises people is that the lagging indicator, dwell, is the one everybody watches. By the time dwell moves, the yard is already full.
Leading indicators worth instrumenting:
- Vessel bunching. Two or three vessels arriving inside a window sized for one is the single most reliable predictor. Discharge arrives in concentrated bursts, and the yard absorbs the burst or it does not.
- Berth window slippage upstream. A vessel running late from its previous call will arrive into a window that has already been reallocated.
- Compound fill rate, not compound capacity. Utilisation trending above the level where units can still be marshalled efficiently is the real signal. A yard at nominal capacity is already gridlocked, because retrieval requires space to move.
- Processing and inspection throughput per shift. If units are discharging faster than they can be processed, the backlog is forming regardless of the berth.
- Inland dispatch rate against discharge rate. The clearing rate is what determines whether a burst is absorbed or accumulates.
- Carrier acceptance rate on outbound lanes. Falling acceptance is capacity tightening before it shows up in transit times.
Our coverage of compound management and yard operations covers the dwell taxonomy in detail. The point here is that the signals sit upstream of dwell, and an OEM that waits for dwell to move has already lost the cheap options.
Contingency options, and what each costs
There are four levers, and they are not equally available. Sequencing matters because the cheap ones expire first.
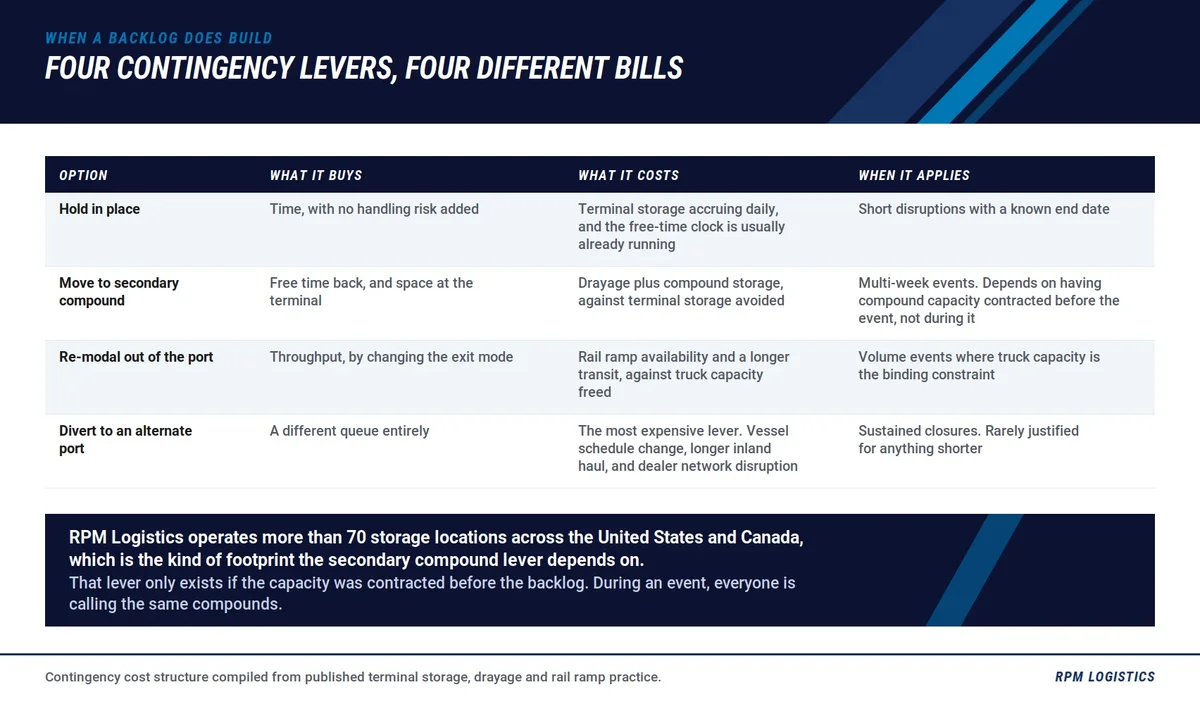
Each lever buys a different thing. Picking the wrong one is usually a sequencing error, not a pricing one.
Hold in place
Do nothing and absorb the dwell. Costs are yard rent or per-diem, working capital tied up in unsold inventory, and exposure to lot damage and weather. It is the right answer when the backlog is short and the alternative is expensive repositioning that ends with the units in the wrong place anyway.
The trap is treating it as the default. Holding is a decision, and it should be made explicitly with a review date rather than by not acting.
Move to secondary compound
Relieve the port yard by repositioning units to overflow capacity inland. This buys processing and marshalling room, which is frequently the actual constraint, and it converts an uncontrolled dwell into a controlled one.
The economics turn on whether the secondary location is on the route to the eventual destination. Repositioning that moves units closer to market is cheap at worst. Repositioning sideways to relieve pressure is pure cost. RPM Logistics operates more than 70 storage locations across the United States and Canada, which is the kind of footprint this lever depends on.
Pre-contract it. Overflow capacity negotiated during an event is priced accordingly, and the good locations are taken by whoever planned first.
Re-modal out of the port
Shift the outbound leg between truck and rail to match whatever capacity is actually available. Rail moves volume and is the right answer for distant markets; truck is faster to activate and better for regional clearing. Our comparison of rail and truck break-even for finished vehicles covers where the crossover sits.
The constraint on rail during an event is equipment rather than track. Multilevel railcar availability is the thing to confirm before assuming rail is the relief valve.
Divert to an alternate port
The largest lever and the slowest. Diversion has to happen while the vessel is still at sea, which means the decision is made on leading indicators or not at all. It also requires that the alternate port has processing capacity, not just berth availability, and that inland lanes from the alternate port exist at the volume you need.
Given volume concentration, the realistic alternates for any given lane are few. Identify them before you need them, and know what each one can actually absorb.
Deciding which units move first
When capacity is short, something has to determine sequence, and "first discharged, first moved" is the worst available rule because it is uncorrelated with value.
A workable priority order:
- Units with a customer attached. A sold unit has a downstream commitment and the highest cost of delay.
- Units for dealers at low days' supply. Inventory gaps cost more than inventory surplus.
- Units approaching a model year changeover. Value decays on a cliff rather than a slope.
- High-value trims. Carrying cost scales with value.
- Everything else, by age in yard.
The corollary matters too: during an event, some units should deliberately be left to sit. Trying to clear everything at event pricing is how a congestion cost becomes a transport cost without improving the outcome.
Triggers worth writing down
A contingency plan that requires a judgement call under pressure is a plan that gets made late. Thresholds should be set in advance, calibrated to your own operation rather than to an industry figure that does not exist.
- Compound fill rate above your marshalling threshold for a defined number of consecutive days triggers secondary compound activation.
- Two or more vessels scheduled inside a single discharge window triggers a pre-emptive capacity check rather than a reaction after discharge.
- Inland dispatch rate below discharge rate for a defined period triggers a re-modal review.
- Any event affecting a port with no viable alternate triggers the diversion decision immediately, because the window closes while the vessel is at sea.
Set the numbers from your own history. The threshold that matters is the one where your yard stops being able to retrieve units efficiently, and that is a property of your layout and your processing throughput, not of the industry.
Recovering after the event
The phase nobody plans is the one after the backlog clears, and it is where a contingency plan either pays for itself or quietly does not.
When capacity returns, the instinct is to flush everything at once. That reproduces the original problem in a different place: a surge of units arriving simultaneously at dealers and compounds that sequenced their own operations around the delay. It also lands at the moment outbound capacity is most contested, because every other shipper is doing the same thing.
Three things worth building into the plan in advance:
- Meter the clearing rate to what the receiving end can actually absorb, rather than to what the yard wants to release. The constraint has moved downstream.
- Re-sequence rather than resume. Priority order should be recalculated against current conditions, not against the order units were held in. A unit that was urgent three weeks ago may have been sold around.
- Reconcile the condition record. Units that sat longer than planned accumulated exposure, and separating yard damage from transport damage is far harder after a surge than during one. See photo condition reporting.
Federal maritime statistics and port performance reporting from MARAD and BTS are useful for calibrating what normal looked like before the event, which is the reference point for deciding when recovery is actually complete.
What to tell dealers
The communication failure is more damaging than the delay in most events. A dealer told nothing assumes the worst and sells around the unit; a dealer given a revised date plans against it.
Three commitments worth making in advance: notification within a defined window of the delay being identified rather than when it is resolved, a revised estimate with the basis stated, and a named contact for exception handling rather than a general inbox. Our coverage of finished vehicle logistics lead times covers what a realistic revised estimate looks like.
Frequently asked questions
How is vehicle port congestion different from container port congestion?
Container congestion is berth-driven, with vessels queueing and cranes as the constraint. Vehicle congestion is yard-driven: RoRo discharge is comparatively fast because units drive off, and the constraint sits downstream in compound capacity, processing and inspection throughput, and inland transport. A vehicle terminal can discharge on schedule and still be gridlocked.
What is a normal vehicle dwell time at a US port?
There is no reliable published figure. Neither the Bureau of Transportation Statistics nor port authorities publish finished vehicle cargo dwell, and the leading trade coverage of the subject argues dwell is the binding constraint without quantifying it. BTS does publish RoRo vessel time at berth, running roughly 25 to 40 hours across tracked ports for January through October 2025, but that is vessel-side and not a cargo dwell measure.
Are the Section 301 fees on foreign-built car carriers currently in effect?
No. The fee basis was changed to $46 per net ton effective October 14, 2025, then the entire action was suspended from November 10, 2025 through November 9, 2026, with no liability accruing during the suspension. The widely quoted $150 per car equivalent unit figure is superseded. The suspension lapses November 9, 2026.
When should an OEM activate a port contingency plan?
On leading indicators rather than on dwell, because dwell is a lagging measure and by the time it moves the cheap options have expired. Useful triggers are compound fill rate above the level where units can still be marshalled efficiently, two or more vessels scheduled inside a single discharge window, and inland dispatch rate falling below discharge rate.
Is it cheaper to hold vehicles at the port or move them to a secondary compound?
It depends on whether the secondary location sits on the route to the eventual destination. Repositioning that moves units closer to market is cheap at worst. Repositioning sideways purely to relieve pressure is pure cost. Holding is the right answer for short backlogs, but it should be an explicit decision with a review date rather than a default.
Which US ports handle the most finished vehicles?
For calendar 2025, Brunswick handled roughly 779,000 units, Baltimore 728,225, Jacksonville 416,721, New York and New Jersey 361,283, Hueneme 357,498 and San Diego 346,415. Los Angeles fell to 91,862, down about 35% year over year. That concentration limits how much diverted volume the system can absorb.
Is RoRo shipping capacity tight in 2026?
The verifiable evidence points to loose capacity rather than tight. The pure car and truck carrier orderbook has run around 35% of the existing fleet, and charter rates fell from a 2023 peak above $110,000 a day to roughly $47,500 a day for large vessels as of August 2025, which is the most recent publicly verifiable print. Sources asserting tight 2026 capacity generally do not cite anything.
Which units should move first when port capacity is short?
Units with a customer attached, then units for dealers at low days' supply, then units approaching a model year changeover, then high-value trims, then everything else by age in yard. First discharged, first moved is the worst rule available because it is uncorrelated with value.
Planning before the backlog
RPM Logistics moves finished vehicles from port to dealer across all 50 states and Canada, with more than 70 storage locations available as overflow capacity and both truck and rail options on outbound lanes. If you want a contingency plan built while conditions are calm, talk to our team.