

Quick answer: Peak season vehicle transport is the stretch of the year when shipper demand for car-haul trucks outruns available capacity. For B2B shippers it runs in waves: tax-refund used demand in February to April, model-year changeover from late summer, and the fourth-quarter dealer push. Secure trucks by forecasting volume, committing core lanes early, keeping backup carriers and flexing pickup windows.
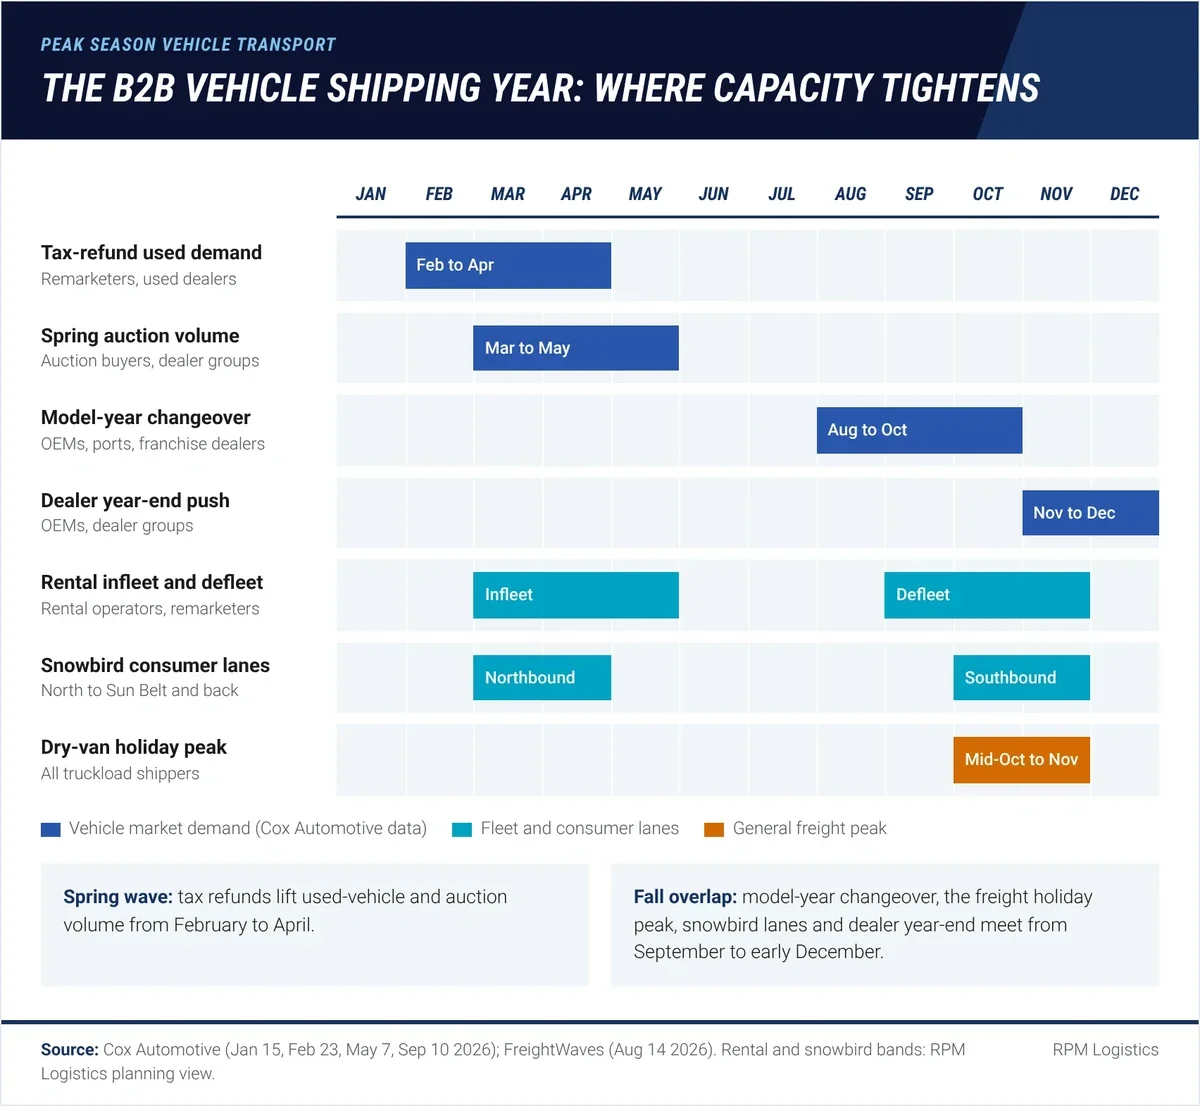
The squeeze is worst where bands overlap. For most vehicle shippers that is September through early December.
Carrier capacity planning is the work of matching your forecast vehicle volume to trucks you have lined up before you need them. In vehicle logistics, that means car-haul trailers and drivers, plus the backup options you can switch to when a primary carrier says no. Consumer car-shipping guides describe one summer peak. B2B shippers face several, and they come from different parts of the vehicle business.
This guide lays out the B2B vehicle peak calendar, explains why car-haul capacity behaves differently from dry-van capacity, and gives a four-stage planning model. It does not repeat rental-operator repositioning. That lives in our guide to how rental companies plan seasonal fleet repositioning. Transit-day benchmarks by mode are also covered separately.
When is peak season for B2B vehicle shipping?
Peak season for B2B vehicle shipping is not one window. It is a sequence of demand waves set by tax refunds, the model-year cycle, dealer year-end targets and fleet cycles. Each wave lands on a different shipper group, and the waves overlap in the fall.
The calendar below maps each wave to the months it usually runs and the shippers who feel it first. The data notes come from 2026 market releases.
Months | Demand driver | Who feels it first | 2026 data point |
|---|---|---|---|
February to April | Tax-refund used-vehicle demand | Remarketers, used-vehicle dealers, auctions | Refunds ran 14% above the 2025 pace in February (Cox Automotive, 2026) |
March to May | Spring wholesale and auction volume | Auction buyers, dealer groups | April auction sales conversion 63.7%, 3.3 points above the three-year April average (Cox Automotive, 2026) |
Spring and fall | Rental fleet infleet and defleet | Rental operators, remarketers | Timing varies by operator; see rental guides |
August to October | Model-year changeover | OEMs, ports, franchise dealers | MY2027 units were 12.4% of new inventory in August, versus 23% for MY2026 a year earlier (Cox Automotive, 2026) |
Mid-October to early November | Dry-van holiday retail peak | All truckload shippers | FreightWaves expected peak tightening in this window (FreightWaves, 2026) |
October to November, March to April | Snowbird consumer lanes | Shippers on Northeast and Midwest to Sun Belt lanes | Consumer demand competes for the same open carriers |
November to December | Dealer year-end push | OEMs, dealer groups | December 2025 new sales rose nearly 12% month over month (Cox Automotive, 2026) |
Tax-refund season moves used inventory first
Tax-refund season is the late-winter period when refund checks lift used-vehicle demand. In 2026, refunds were running 14% above the prior year's pace in February, and Manheim values were accelerating (Cox Automotive, February 2026). Through February 27, the average refund stood at just over $3,700, up 10.6% (Cox Automotive, 2026).
The trucking effect shows up at auctions. Cox reported April 2026 wholesale sales conversion of 63.7%, 3.3 points above the recent April average (Cox Automotive, May 2026). Higher conversion means more sold units leaving lanes at once. If you buy at auction, read our guide to auction vehicle transport and gate release timing.
Model-year changeover and the year-end push
Model-year changeover is the period when new-model-year units start shipping while the prior year's units are still being cleared. In August 2026, MY2027 vehicles made up 12.4% of new inventory, up from 5.6% in July (Cox Automotive, September 2026). A year earlier, MY2026 units were already 23% of supply.
A slower start does not remove volume. It pushes more of it into the fall. In its September 24 forecast presentation, Cox noted that available supply "ballooned quickly back to 3 million units" in Q4 last year. December then pulls hard: sales rose nearly 12% month over month in December 2025, and days' supply fell from 92 to 76 (Cox Automotive, January 2026).
Why do vehicle peaks stack up in the fall?
Vehicle peaks stack up in the fall because three separate demand sources hit the same months. Model-year changeover, the general freight holiday peak and southbound snowbird lanes all land between September and early December.
The general freight market sets the backdrop. A FreightWaves analyst described the summer dip in tender rejections as "normal seasonal behavior." They expected peak-season tightening from mid-October through early November (FreightWaves, August 2026). That window sits on top of model-year deliveries and dealer year-end stocking.
Add the consumer layer. Consumer car-shipping guides name summer as the main peak, with snowbird moves in late autumn and early spring. Those consumer loads ride the same open carriers that serve dealers. A dealer group shipping from a Northeast port into Florida in November competes with retirees moving the same direction.
Inventory levels add pressure from the supply side. New-vehicle inventory was 2.68 million units with 73 days' supply in August 2026, the lowest days' supply since April 2025 (Cox Automotive, September 2026). Lean inventory means dealers want units delivered fast, which leaves less room to wait for a cheaper truck.
How does car-haul capacity differ from dry-van capacity?
Car-haul capacity is a specialized pool of trucks that can legally and physically carry finished vehicles. Unlike a dry van, most of that equipment cannot switch freight types when vehicle demand drops. That makes the pool slow to grow during a peak.
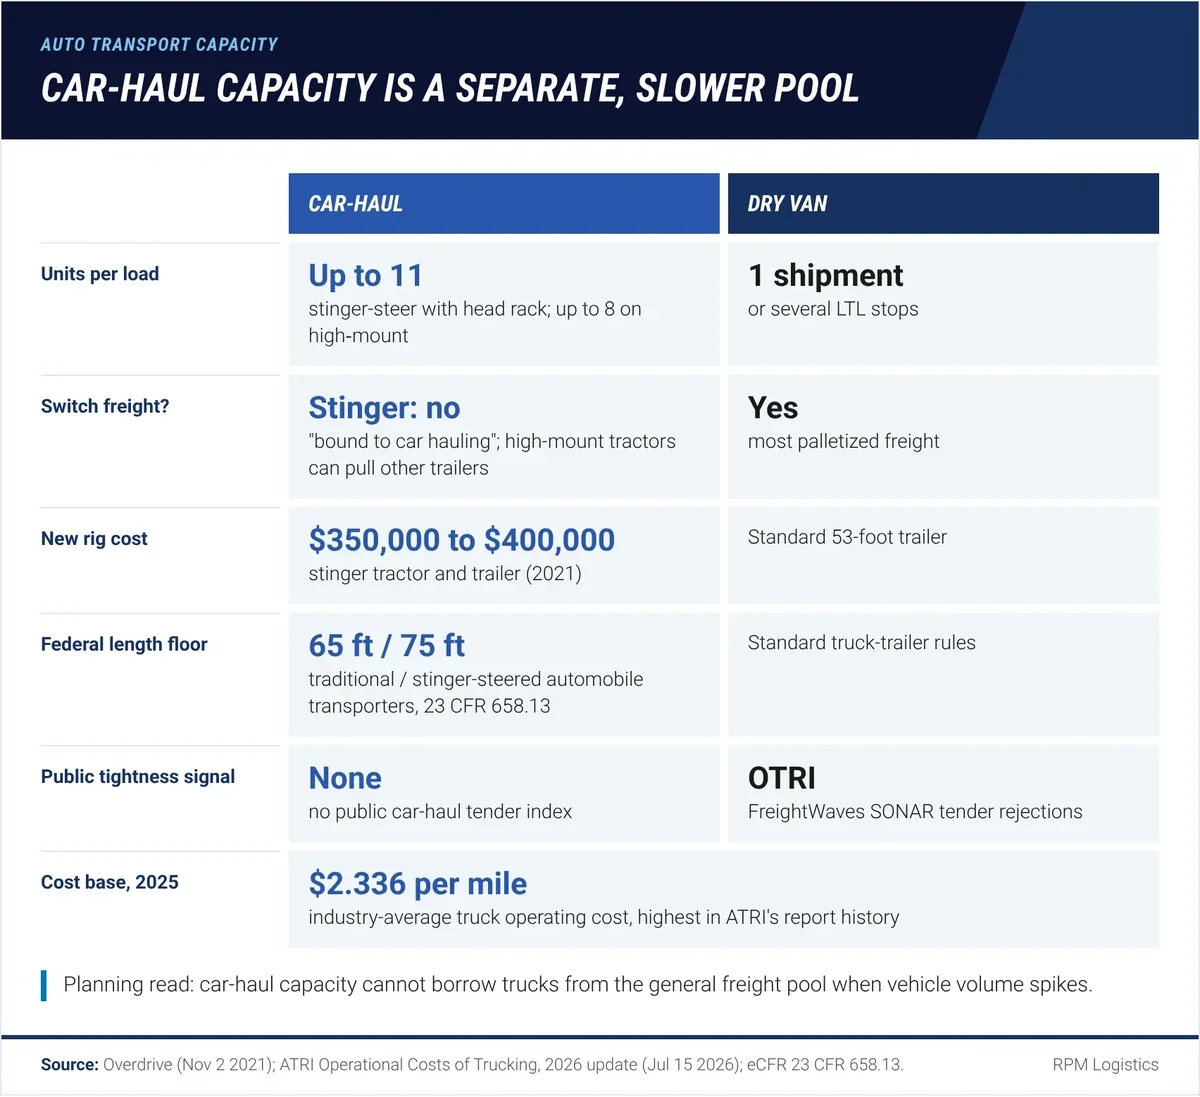
Dry-van tender data is public. Car-haul capacity has no equivalent index, so shippers read it indirectly.
Equipment drives the difference. A stinger-steer car hauler can carry up to 11 vehicles with a head rack, and a high-mount trailer tops out at eight (Overdrive, 2021). Stinger setups are "bound to car hauling," per the same report. A new stinger tractor and trailer ran $350,000 to $400,000 (Overdrive, 2021).
Federal size rules also treat these rigs as their own class. Under 23 CFR 658.13, states may not cap traditional automobile transporters below 65 feet or stinger-steered units below 75 feet. A carrier cannot add car-haul capacity by renting a spare van trailer. The table below compares the two pools for a shipper planning peak volume.
Factor | Car-haul capacity | Dry-van capacity |
|---|---|---|
Equipment | Stinger-steer, high-mount and wedge trailers built for vehicles | Standard 53-foot trailers that take most palletized freight |
Units per load | Up to 8 on high-mount, up to 11 on stinger-steer (Overdrive, 2021) | One shipment or several LTL stops |
Ability to switch freight | Stinger rigs stay in car hauling; high-mount tractors can pull other trailers | Moves freely between commodities |
Public tightness signal | No public car-haul tender index | Outbound Tender Reject Index (OTRI) and spot rates |
Backhaul pattern | Loads flow from plants, ports and rail ramps to dealers; return loads depend on auction and remarketing volume | Broad two-way freight in most markets |
Cost base | Industry-wide $2.336 per mile in 2025 (ATRI, 2026) | Truckload segment $2.21 per mile in 2025 (ATRI, 2026) |
Cost pressure limits how fast car haulers add trucks. The industry-average cost to run a truck reached $2.336 per mile in 2025, the highest in the report's history (ATRI, 2026). Carriers in the study cut truck counts by 2.4% and left 10% of trucks unseated on average (Transport Topics, July 2026).
The backhaul pattern matters too. A truck that delivers nine new units to a dealer may return empty unless auction or trade-in volume is waiting nearby. That empty return gets priced into the outbound move, and it worsens when every truck heads the same way in the same month. For the general truckload mechanics, see our primer on what truckload capacity is and how it works.
What does tender rejection data tell a vehicle shipper?
Tender rejection is a contract carrier declining a load it was offered at the agreed rate. The FreightWaves SONAR Outbound Tender Reject Index (OTRI) tracks the share of contract loads rejected. FreightWaves reads anything above 10% as shippers struggling to cover freight (FreightWaves, 2025).
In late summer 2026, the index sat above that line. OTRI stood at 13.45% on September 10, 2026, well above prior years (FreightWaves, September 2026). In May 2025 it sat near 6.69% (FreightWaves, 2025). The June 2026 Logistics Managers' Index put transportation capacity at 28.4%, far below the neutral 50 (CCJ, June 2026).
OTRI measures general truckload, not car haul. Still, it is the best public early warning a vehicle shipper has. When dry-van rejections climb, high-mount operators who can pull other trailers have more options. Fuel adds to the squeeze: FreightWaves reported retail diesel approaching $6 per gallon in September 2026.
Use three signals together:
- Your own acceptance rate by lane, measured weekly. It is the only car-haul-specific signal you control.
- OTRI direction over four to six weeks, not single readings.
- Cox inventory and days' supply releases, which show when OEM and dealer volume is about to move.
The four-stage capacity planning model for vehicle shippers
A vehicle transport capacity plan is a written schedule of how much truck capacity you will hold, from whom, and what you do when it falls short. We use four stages: forecast, commit, buffer and flex. Each stage has a different owner and a different deadline relative to the peak.
- Forecast (one quarter before the peak). Build weekly unit counts by origin, destination and vehicle type. Tie them to the drivers in the calendar above: production releases, auction run lists, defleet schedules and dealer allocations. Flag oversized units and EVs, since weight cuts units per load.
- Commit (before the peak window opens). Lock core lanes with written volume and rate terms. Award through your RFP cycle so carriers can plan equipment. Committed capacity is the share you expect to move with no surprises.
- Buffer (same time as commit). Name a second and third carrier for each high-volume lane. Set the price and acceptance rules for backups now, not during the squeeze. A routing guide only one carrier deep is a single point of failure.
- Flex (during the peak). Widen pickup windows, stage units at compounds, and shift distant lanes to rail where volume supports it. Reserve expedited trucks for units with a hard deadline.
The commit stage is where most programs fall short. A forecast nobody shares with carriers does not secure trucks. Share the forecast with your committed carriers and update it on a fixed day each week.
Rail is a real flex lever on long lanes with enough units. Our analysis of rail versus truck break-even for finished vehicles shows where the crossover sits. For time-critical units, a dedicated truck can be worth the premium; see our guide to expedited finished vehicle freight.
Committed capacity versus spot capacity
Committed capacity is truck space a carrier has agreed in writing to provide on a lane at set terms. Spot capacity is whatever is available the day you post the load. Peak plans need both, in a deliberate mix.
The table below compares the four sources of capacity a vehicle shipper can draw on in peak season.
Capacity source | What it gives you | Peak-season risk | Best use |
|---|---|---|---|
Committed contract lanes | Planned volume at agreed terms | Tender rejections rise when the market tightens | Core, repeat origin-destination pairs |
Routing-guide backups | Second and third carrier options at pre-set rates | Backups may be committed elsewhere if never used off-peak | High-volume lanes where one rejection stalls a release |
Spot market | Fast access with no commitment | Price and availability move daily | Overflow and one-off moves |
Expedited or dedicated trucks | A truck for one urgent job | Highest cost per unit | Hard-deadline units only |
Keep backup carriers warm. Send them a few loads off-peak so they know your sites, your release process and your paperwork. A backup who has never moved your units will put you behind their regular shippers when everyone calls at once.
Ports need their own plan. Import surges and vessel bunching can flood a port lot just as dealers need units. Our guide to port congestion and finished vehicle throughput covers contingency planning for that case.
Peak season vehicle transport planning checklist
A peak season checklist is the short list of tasks that must be done before the first wave arrives. Use it each quarter, not once a year.
- Map your own volume against the B2B peak calendar and mark the overlap weeks.
- Share a weekly unit forecast by lane with committed carriers.
- Award core lanes in writing before the peak window opens.
- Name at least two backup carriers per high-volume lane and send them loads off-peak.
- Agree acceptance and rate rules for backups in advance.
- Publish pickup windows of several days, not single dates, where your sites allow it.
- Line up compound or storage space for units that arrive before a truck does.
- Track tender acceptance by lane weekly, alongside OTRI direction.
- Set expedite criteria so only hard-deadline units go on a dedicated truck.
- Plan rental defleet and auction volume as return loads where lanes allow; see our rental fleet de-fleeting logistics guide.
For realistic transit time once a truck is booked, use our finished vehicle logistics lead time benchmarks. Booking lead time and transit time are different numbers, and peak season stretches both.
Frequently Asked Questions
What is peak season in vehicle logistics?
Peak season in vehicle logistics is any period when demand for car-haul trucks exceeds the capacity available at normal terms. For B2B shippers it comes in waves: tax-refund used-vehicle demand from February to April, model-year changeover from August to October, and the dealer year-end push in November and December. The fall waves overlap with the general freight holiday peak.
When is the busiest time to ship vehicles for dealers and OEMs?
September through early December is usually the tightest stretch for dealers and OEMs. Model-year changeover, the general freight peak from mid-October to early November and southbound snowbird lanes overlap then. In 2026, MY2027 units were only 12.4% of new inventory in August, which pushes more model-year volume later into the fall (Cox Automotive, 2026).
What are the steps of carrier capacity planning?
Carrier capacity planning has four steps. Forecast weekly units by lane about one quarter before the peak. Commit core lanes in writing before the peak opens. Buffer each high-volume lane with named backup carriers at pre-set terms. Flex during the peak with wider pickup windows, compound staging, rail on long lanes and expedited trucks for hard-deadline units.
Why does car-haul capacity tighten faster than dry-van capacity?
Car-haul capacity tightens faster because the equipment is specialized. Stinger-steer rigs carry up to 11 vehicles and are bound to car hauling, so carriers cannot add trucks by borrowing other trailers. New rigs cost $350,000 to $400,000 (Overdrive, 2021). With trucking costs at a record $2.336 per mile in 2025, carriers add capacity cautiously (ATRI, 2026).
Does peak season raise vehicle transport rates?
Peak season usually raises vehicle transport rates on tight lanes because carriers can choose higher-paying loads. The size of any increase varies by lane, timing and equipment, so treat published consumer premiums with caution. The more reliable signal is tender rejection: OTRI was 13.45% on September 10, 2026, above the 10% level FreightWaves links to spot-market pressure.
Plan your next peak with RPM
A peak plan only works if trucks are lined up before the waves arrive. RPM arranges vehicle transport across all 50 states and Canada through a national network of contracted, independently operated carriers, with 70+ storage locations for staging. Request an RFP to map your next peak against committed and backup capacity.