

Quick answer: The latest cargo theft statistics show fewer thefts and larger losses. Verisk CargoNet counted 677 US and Canadian incidents in Q2 2026, down 26% year over year. Estimated losses reached $304.6 million. CargoNet's 2025 total was nearly $725 million across 2,646 confirmed thefts, up 60% in dollar terms.
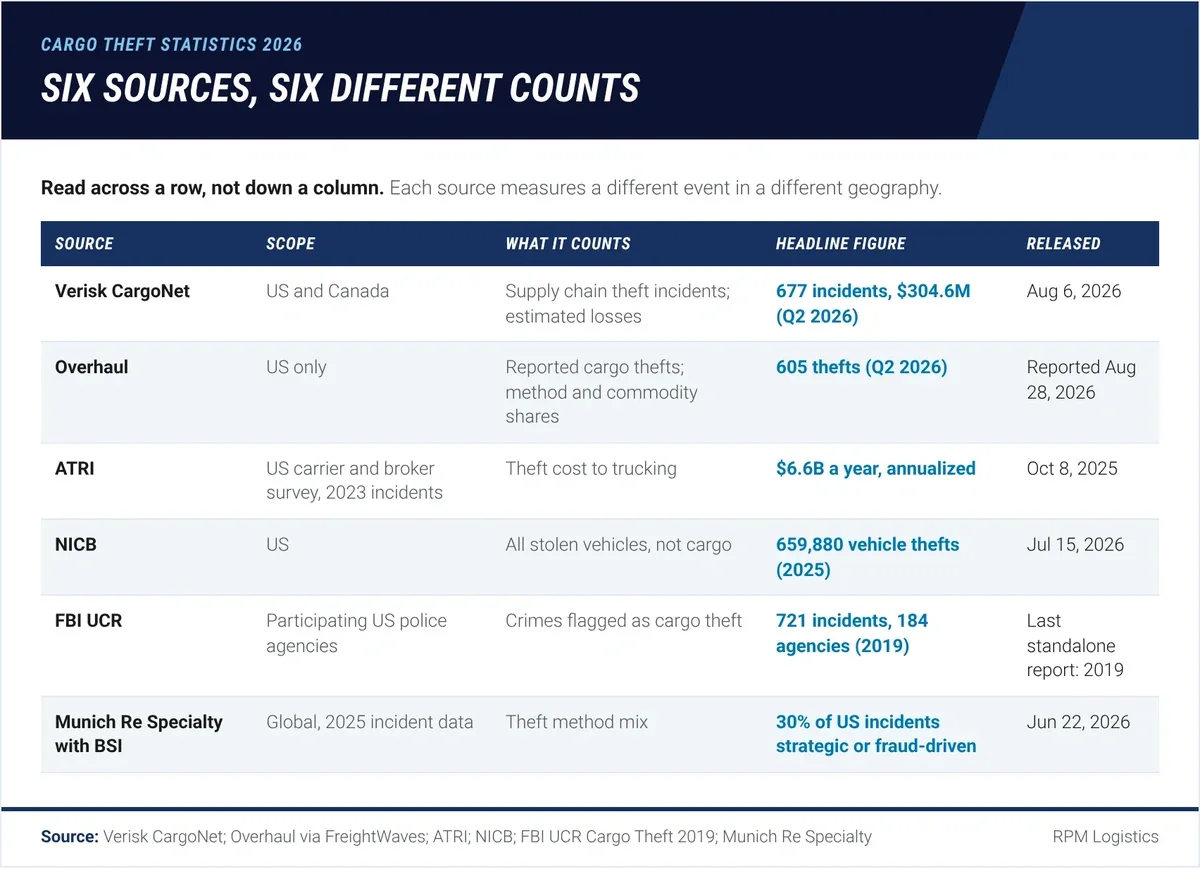
Compare figures within a row: no two of these sources count the same thing.
Cargo theft is the theft of goods from a commercial freight shipment moving in commerce, as defined on the FBI's cargo theft page. The figures on this page come from six sources that measure different things. Some count incidents, some estimate dollars, and one counts stolen vehicles of every kind.
This page is a statistics reference. Every figure carries its source and release date, and no source is dated after September 20, 2026. For the story behind the 2026 shift, read our analysis of how freight fraud changed in 2026.
Cargo theft statistics at a glance
The core cargo theft statistics for 2025 through mid-2026 fit in eight lines. Each line names the publisher and the release date.
- $725 million: estimated US and Canada cargo theft losses in 2025, up 60% from 2024 (Verisk CargoNet, Jan 22, 2026).
- 2,646: confirmed cargo thefts in 2025, up 18% (Verisk CargoNet, Jan 22, 2026).
- $273,990: average value per theft in 2025, up 36% from $202,364 in 2024 (Verisk CargoNet, Jan 22, 2026).
- 677: supply chain theft incidents in Q2 2026, down 26% year over year (Verisk CargoNet, Aug 6, 2026).
- $304.6 million: estimated Q2 2026 losses, against $135.7 million in Q2 2025 (Verisk CargoNet, Aug 6, 2026).
- 605: US cargo thefts in Q2 2026, up 5% from Q1 and down 5% year over year (Overhaul, reported Aug 28, 2026).
- $6.6 billion: annualized cost of cargo theft to trucking, about $18 million a day (ATRI, Oct 8, 2025).
- 659,880: US vehicle thefts of all kinds in 2025, down 23.2% (NICB, Jul 15, 2026).
What each cargo theft dataset counts
No single dataset covers the whole cargo theft market. Each source counts a different event in a different geography. The table below sets out the scope of the six sources quoted most often in 2026.
Source | Geography | What it counts | Latest headline figure | Release date |
|---|---|---|---|---|
Verisk CargoNet | US and Canada | Supply chain theft incidents, confirmed thefts, estimated losses | 677 incidents, $304.6 million (Q2 2026) | Aug 6, 2026 |
Overhaul | US only (Mexico reported separately) | Reported cargo thefts, method and commodity shares | 605 thefts (Q2 2026) | Reported Aug 28, 2026 |
ATRI | US carrier and logistics provider survey | Theft losses and costs, 2023 incidents | $6.6 billion a year, annualized | Oct 8, 2025 |
NICB | US | All stolen vehicles, not cargo | 659,880 vehicle thefts (2025) | Jul 15, 2026 |
FBI Uniform Crime Reporting | Participating US law enforcement agencies | Crimes flagged as cargo theft | 721 incidents from 184 agencies (2019) | Last standalone report covers 2019 |
Munich Re Specialty with BSI | Global, 2025 incident data | Theft method mix, insider involvement | 30% of US incidents strategic or fraud-driven | Jun 22, 2026 |
The two quarterly trackers moved in different directions in Q2 2026. CargoNet's count fell 14% from Q1, while Overhaul's rose 5%. Both fell year over year, by 26% and 5% respectively. FreightWaves' report on the Overhaul data notes that it covers reported cases, not a complete count of every theft.
The FBI figure is the oldest on the list. The UCR program's last standalone cargo theft report covers 2019. That year, 184 agencies reported 721 incidents and $139.7 million in stolen property. The FBI's 2017 edition noted that participation was incomplete because of resource limits and state priorities.
CargoNet headline numbers, 2025 to mid-2026
Verisk CargoNet publishes widely cited cargo theft totals for the US and Canada. The table lists every CargoNet total released between January and September 2026, using Verisk's own metric labels.
Period | Events or incidents | Thefts | Estimated losses | Average loss | Released |
|---|---|---|---|---|---|
Full year 2025 | 3,594 supply chain crime events (3,607 in 2024) | 2,646 confirmed thefts, up 18% | Nearly $725 million, up 60% | $273,990, up 36% | Jan 22, 2026 |
Q1 2026 | 767 events, down 5.3% year over year and 12.2% from Q4 2025 | 596 confirmed theft reports | $131.58 million, essentially flat year over year | Not stated | Apr 24, 2026 |
Q2 2026 | 677 incidents, down 26% year over year | 378 thefts (488 in Q2 2025); 158 fictitious pickups (165) | $304.6 million (Q2 2025: $135.7 million) | $564,009 | Aug 6, 2026 |
First half 2026 (early estimate) | Not stated | Not stated | More than $359 million | About $341,518 | Jul 1, 2026 (repeated Sep 4, 2026) |
The Q2 average needs a caveat. Verisk calculated it only across thefts with a reported commodity value. It also said a small number of extreme, multimillion-dollar losses heavily influenced the figure.
The labels matter too. Verisk reports "events," "incidents" and "confirmed thefts" in different releases. Treat them as separate measures unless Verisk says otherwise.
The H1 2026 total: $359 million, not $436 million
CargoNet's half-year figure of "more than $359 million" first appeared in its July 1, 2026 release. That was one day after the half ended and five weeks before the Q2 estimate. The September 4, 2026 release repeats it. Adding the Q1 and Q2 releases gives $436.18 million, about $77 million more.
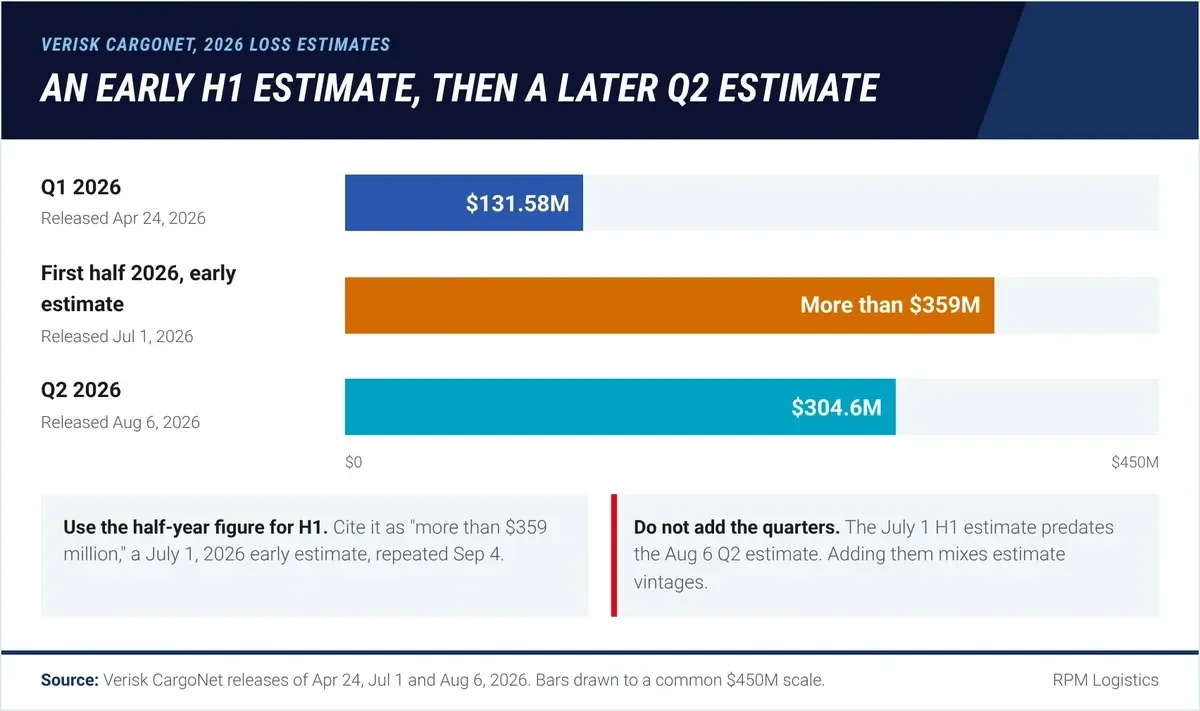
The July 1 half-year estimate predates the August 6 Q2 estimate, so the two cannot be reconciled by adding.
The timing explains the gap. The $359 million figure is an early estimate published July 1. The Q2 figure of $304.6 million is a later estimate published August 6. The two come from different points in Verisk's estimating cycle, so they should not be combined.
The safe approach is simple:
- For the half year, cite "more than $359 million (Verisk CargoNet early estimate, Jul 1, 2026)."
- For a single quarter, cite that quarter's figure with its own release date. The Q2 figure is the later estimate.
- Do not add quarterly estimates to build a half-year or annual total.
- Do not compare the Q2 average of $564,009 with the half-year average of about $341,518. They cover different periods and come from different release dates.
The same caution applies to counts. The Q1 release reports 767 "events," while the Q2 release reports 677 "incidents." Adding them gives 1,444, but the two releases do not use the same label.
How cargo is stolen: method statistics
Physical theft still makes up most reported incidents. Fraud-based methods account for 11% to 30% of US incidents, depending on the source. The table groups the method data by publisher, scope and date.
Source and scope | Method figures |
|---|---|
Overhaul, Q2 2026, US (reported Aug 28, 2026) | Pilferage 46%; full truckload theft 21%; facility theft 16%; deceptive pickup 11% |
Overhaul, Q1 2026, US (reported May 18, 2026) | Deceptive pickup schemes up 31% year over year, nearly half of them in California |
Munich Re Specialty with BSI, 2025 data (Jun 22, 2026) | 30% of US incidents strategic or fraud-driven; 22% of thefts globally involved insiders |
ATRI, 2023 incidents (Oct 2025) | Motor carriers: pilferage 39.9%, straight theft 31.5%, strategic theft 20.3%. Brokers and logistics providers: strategic theft 62.5% |
Verisk CargoNet, Q2 2026 (Aug 6, 2026) | 158 fictitious pickups, against 165 in Q2 2025; business email compromise the main access point for many of the most sophisticated schemes |
Highway Freight Fraud Index, Q2 2026 (Jul 28, 2026) | Ownership-change fraud in 25.6% of reported thefts, up from 23.0% in Q1 |
Strategic theft uses deception instead of force. It includes identity theft, account takeover and the fictitious pickup, where a fake carrier collects a load. Our guide to stopping a fictitious pickup at the gate covers the release-point checks.
ATRI's broker figure stands out. Strategic theft made up 62.5% of incidents reported by brokers and logistics providers, about three times the motor carrier share. Schemes that route freight through unauthorized parties fall in this group, as our explainer on what double brokering is describes.
What gets stolen: commodity statistics
Food and beverage is the most-stolen category by count in CargoNet's data. Electronics leads Overhaul's US shares. The table shows each publisher's top categories with dates.
Source and period | Top targeted commodities |
|---|---|
Verisk CargoNet, 2025 (Jan 22, 2026) | Food and beverage 708 thefts, up 47%; metals thefts up 77%, driven by copper products |
Verisk CargoNet, Q1 2026 (Apr 24, 2026) | Food and beverage 144 events, the top category; personal care and beauty 50 events, up from 18; building materials 8, down from 21 |
Verisk CargoNet, Q2 2026 (Aug 6, 2026) | Metals 80 thefts, up from 54, with copper the most targeted metal; enterprise computing, networking and crypto-mining hardware also targeted |
Overhaul, Q1 2026, US | Electronics 17%; food and drinks 15%; auto and parts 11%; clothing and shoes 11% |
Overhaul, Q2 2026, US | Electronics 23%; miscellaneous cargo 20%; clothing and shoes 10% |
Verisk CargoNet, Labor Day 2021 to 2025 (Sep 4, 2026) | Food and beverage 49; household goods 27; electronics 25; vehicles and accessories 20; metals 11 (of 273 incidents) |
Count and value tell different stories. In CargoNet's data, food and beverage loads are stolen most often. Metals and enterprise technology drove the Q2 2026 loss total, according to Verisk. That split is why a load's value, not just its commodity, sets its risk tier. Our breakdown of what counts as high-value freight covers the thresholds.
Where cargo theft happens: state and holiday hotspots
California leads every current industry dataset reviewed here by incident count. The table shows state rankings by source and period.
Source and period | State figures |
|---|---|
Verisk CargoNet, 2025 | California 1,218 incidents. Year-over-year increases: New Jersey 50%, Indiana 30%, Pennsylvania 24%; Kern County, CA 82%; San Joaquin County, CA 44% |
Verisk CargoNet, Q1 2026 | California 277 (from 255); Texas 80 (from 102); New Jersey 59 (from 27) |
Overhaul, Q1 2026, US | California 36%; Texas 17%; Illinois 13% (from 6%); Tennessee 12% (from 9%) |
Overhaul, Q2 2026, US | California 34%; Texas 18%; Tennessee 13%; Pennsylvania 10%; Illinois 8% |
Verisk CargoNet, Labor Day 2021 to 2025 | California 70; Texas 38; Illinois 22 (130 of 273 incidents, or 48%) |
CargoNet's Q2 2026 release said the year-over-year decline was especially clear in California and Texas. California still led Overhaul's Q2 shares at 34%.
Holidays concentrate risk. CargoNet logged 273 Labor Day theft events from 2021 to 2025. The count rose from 33 in 2021 to a five-year high of 70 in 2024, then 56 in 2025. The four days around the holiday weekend held 194 of the 273, or 71%. Friday was the busiest day, with 55 incidents.
For vehicles parked over a long weekend, see our guide to vehicle compound and yard operations.
What cargo theft costs carriers and brokers
ATRI puts the cost of cargo theft to trucking at about $6.6 billion a year. The ATRI cargo theft research released October 8, 2025 surveyed motor carriers and logistics providers about 2023 incidents. The table lists its main cost figures.
Measure | ATRI figure |
|---|---|
Industry cost, annualized | $6.6 billion |
Industry cost, per day | About $18 million |
Average annual theft loss per motor carrier | More than $520,000 |
Average annual theft loss per logistics service provider | More than $1.84 million |
Average loss per motor carrier theft | $29,108 (555 incidents, $16.2 million) |
Average loss per logistics provider incident | $95,351 |
Indirect costs (downtime, lost revenue) | 3 to 6 times the value of the stolen cargo |
Do not set ATRI's averages beside CargoNet's. ATRI's $29,108 comes from survey respondents' 2023 thefts. CargoNet's $273,990 comes from 2025 incidents with a reported value. The samples and years differ.
Some widely repeated annual totals run as high as $35 billion. None of the sources reviewed here ties them to a published dataset, so this page leaves them out. For what prevention costs against a loss, see our cargo theft prevention playbook.
Vehicle and auto parts theft statistics
Vehicle shippers face two separate risks: general vehicle theft and theft of vehicles or parts as freight. The NICB counted 659,880 US vehicle thefts in 2025, down 23.2% from 850,708 in 2024. That count covers every stolen vehicle, not only freight, so it is context rather than cargo data.
The freight-specific vehicle figures are thinner. The table collects what was published through September 20, 2026.
Source and date | Vehicle-related figure |
|---|---|
NICB, Jul 15, 2026 | 659,880 US vehicle thefts in 2025, down 23.2% from 850,708 |
Overhaul, Q1 2026, US (reported May 18, 2026) | Auto and parts 11% of cargo thefts; up 142% from Q4 2025 and 51% year over year |
Verisk CargoNet, Q1 2026 (Apr 24, 2026) | Thefts of vehicle-related shipments declined year over year |
Verisk CargoNet, Q2 2026 (Aug 6, 2026) | Substantial decreases in thefts of auto parts and tires |
Verisk CargoNet, Labor Day analysis (Sep 4, 2026) | Vehicles and accessories: 20 of 273 Labor Day incidents, 2021 to 2025 |
U.S. Attorney's Office, District of Columbia (Apr 22, 2026) | Six indicted; at least 20 cars stolen, with the ring linked to 100+ thefts in D.C. and 30+ in Prince George's County, MD; cars shipped in containers through Baltimore to Ghana |
New Jersey Attorney General (Jun 29, 2026) | 63 charged; 90+ vehicles worth over $8 million stolen from June 2025 to June 2026; vehicles recovered from shipping containers at New Jersey and New York ports |
The two trackers disagree on auto parts in Q1 2026. Overhaul reported a sharp rise, while CargoNet reported fewer thefts of vehicle-related shipments. Their category definitions differ, so neither result cancels the other. None of the releases reviewed here breaks out finished vehicles in transit as a separate category.
The enforcement cases show where stolen vehicles go: high-end models, shipping containers and export ports. In the D.C. case, the ring reprogrammed blank key fobs and obscured VINs before export. The pattern matters for high-value dealer inventory moves and for auction vehicle transport, where units pass through several handoffs.
How to cite cargo theft statistics correctly
Cite each figure with its source, scope and release date. Never combine figures across sources. Six rules prevent the errors described above:
- Name the geography. CargoNet covers the US and Canada; Overhaul covers the US only.
- Keep the publisher's label. Events, incidents and confirmed thefts are different measures.
- Date the release, not just the period. CargoNet's Q1 2026 release is dated April 24, 2026.
- Use the latest period total. For H1 2026, the only published total is the July 1 early estimate of "more than $359 million." Do not replace it with the sum of two quarters.
- Do not compare averages across sources. ATRI and CargoNet averages use different samples and years.
- Treat NICB data as vehicle theft. It counts all stolen vehicles, not stolen freight.
Frequently Asked Questions
How common is cargo theft?
Verisk CargoNet recorded 3,594 supply chain crime events in the US and Canada in 2025, including 2,646 confirmed cargo thefts. That works out to about seven confirmed thefts a day. Overhaul, which tracks the US only, reported 605 cargo thefts in Q2 2026. Both figures count reported cases, so the true total is likely higher.
What is the most stolen item in cargo theft?
By count, food and beverage leads CargoNet's data, with 708 thefts in 2025, up 47%. Electronics leads Overhaul's US shares, at 23% of Q2 2026 thefts. By value, metals and enterprise technology drove CargoNet's Q2 2026 losses, with copper the most targeted metal. The answer depends on whether you count loads or dollars.
Why is cargo theft rising?
Losses are rising faster than counts. CargoNet's 2025 losses rose 60% while confirmed thefts rose 18%. In Q2 2026, incidents fell 26% but losses more than doubled to $304.6 million. Verisk says criminal groups now target extremely high-value shipments rather than relying on opportunistic theft. It names business email compromise as a main access point.
What are the latest cargo theft statistics?
As of September 20, 2026, the latest CargoNet quarter is Q2 2026, released August 6. It shows 677 incidents, $304.6 million in estimated losses and a $564,009 average loss. CargoNet's July 1 early estimate put first-half losses above $359 million. Overhaul reported 605 US thefts for Q2 2026, up 5% from Q1.
Why do cargo theft statistics from different sources disagree?
The sources count different things in different places. CargoNet covers the US and Canada and estimates dollar losses. Overhaul covers the US only and reports thefts and shares. ATRI surveyed carriers and logistics providers about 2023 incidents. NICB counts all stolen vehicles, not cargo. Compare figures within one source, and always cite the release date.
Plan vehicle moves around the data
Vehicle shippers can use these statistics to set verification and timing rules for high-risk states and holidays. RPM arranges vehicle transport across all 50 states and Canada. Carriers are screened to RPM onboarding criteria, including MVR checks, before a load is booked. Contact Sales to plan your next vehicle move.