

Quick answer: Finished vehicle logistics KPIs are the contract metrics OEMs use to measure how vehicles move from plant to dealer. The ECG and Odette standard defines nine. They cover plant evacuation, time to port or compound, lead time achievement, port dwell and shipping lead time. Dealer delivery time, damage ratio and two event reporting measures complete the set.
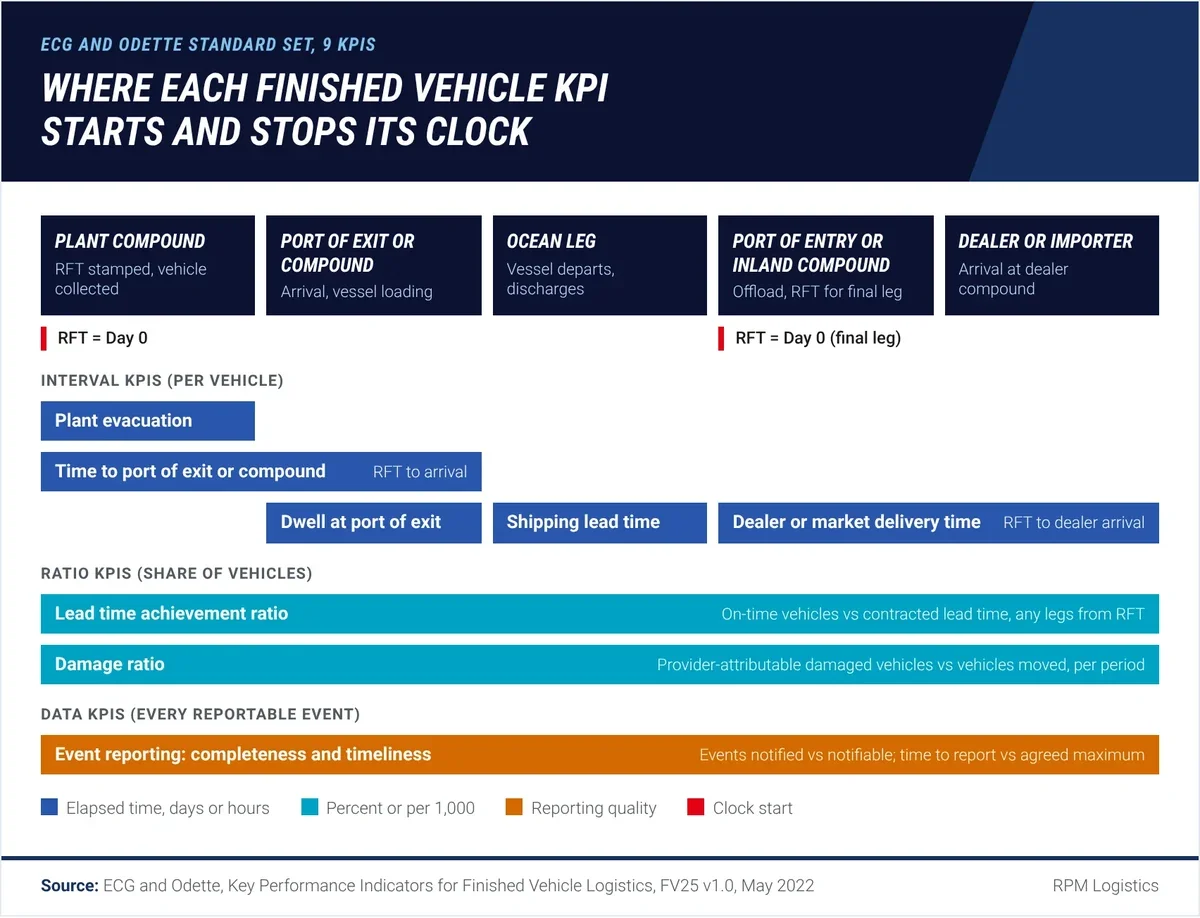
Each KPI is an interval or ratio between named vehicle events. Define the events before any target.
A finished vehicle logistics KPI is a measured interval or ratio, tied to named vehicle events, in an OEM logistics contract. The unit is the vehicle, identified by VIN. That is the core difference from general freight metrics, which count shipments, loads or trips. If you need the wider context first, start with what finished vehicle logistics covers and who does what.
This guide works through the European standard set and translates it to North American rail, haulaway and port networks. It then lays out each KPI with its formula, events, data source and event owner. It does not repeat fleet-buyer outcome metrics. Those live in our guide to fleet transport KPIs for corporate and rental fleets, a different customer with a different job.
What is the ECG and Odette standard KPI set?
The ECG and Odette KPI set is a joint recommendation of nine standard indicators for OEMs and their logistics providers. Odette published it as document FV25, version 1.0, in May 2022 (Odette, 2022). ECG is the Association of European Vehicle Logistics. Odette is the European automotive supply chain standards body.
Five OEMs from four producing countries took part: France, Germany, Sweden and the UK (ECG and Odette, 2022). The stated goal was simple. Providers serving several OEMs were managing a different version of the same metric for each customer. A common definition lets a provider report one way to everyone.
Three rules in the document shape how the set works in practice:
- Ready For Transport (RFT) is Day 0. Most time-based KPIs start their clock at the RFT timestamp.
- Every KPI is measured against the performance level in the contract. The document publishes no target values.
- Not every participating OEM uses all nine. Each agreed with the principle of each indicator.
The table below lists the nine KPIs as defined, with the events that start and stop each clock.
KPI | What it measures | Clock starts | Clock stops | Unit |
|---|---|---|---|---|
Plant evacuation | Average time vehicles spend in the factory compound after RFT | RFT at plant | Collection from plant compound | Days or hours |
Time to port of exit or compound | Time from RFT to arrival at the next node, per vehicle | RFT at plant | Arrival at port of exit or compound | Days or hours |
Lead time achievement ratio | Share of vehicles delivered on time against the contracted lead time | RFT (any leg) | Arrival at dealer or importer compound | Percent |
Dwell at port of exit | Time a vehicle waits in port before its vessel departs | Arrival at port | Vessel departure | Days |
Shipping lead time | Ocean leg from departure to discharge | Vessel departure | Offload at port of entry (first point of rest) | Days |
Dealer or market delivery time | Final distribution leg to the dealer | RFT at port of entry or inland compound | Arrival at dealer compound | Days |
Damage ratio | Vehicles with transport damage attributable to the provider, against vehicles moved | Period start | Period end | Percent or per 1,000 |
Event reporting completeness | Events notified against total notifiable events | Period start | Period end | Percent |
Event reporting timeliness | Time from event to report, against the agreed maximum | Physical event | Report received | Days or hours over limit |
Two details in the definitions are easy to miss. The damage ratio counts a vehicle once, even if it has damage in several areas. And port of exit dwell measures the shipping line, not the port compound operator (ECG, 2022).
Why do OEMs measure vehicles instead of trucks or trips?
OEMs measure at the vehicle level because the VIN, not the load, is the unit of inventory and sale. A load is how a carrier packages vehicles. A trip is how a carrier schedules equipment. Neither tells the OEM when a specific unit reached a specific dealer.
The standard set reflects this. ECG and Odette apply time to port or compound to each individual vehicle. AIAG's North American haulaway scorecard computes damage as VINs damaged divided by VINs moved. Neither counts trucks or trips.
The three measurement levels behave differently, as the comparison below shows.
Level | What it counts | What it hides | Where it still helps |
|---|---|---|---|
Vehicle (VIN) level | Each unit's own start and stop events | Little, if events are complete | Contract KPIs, dealer commitments, claims |
Load level | A railcar or truckload as one record | Units that waited for a load to fill | Equipment use and load planning |
Trip level | One truck movement, origin to last stop | Early stops on a multi-drop route; dwell before dispatch | Carrier cost and driver scheduling |
Load and trip measures can look healthy while vehicles sit. Rail shows why. Autoracks raised capacity from two to ten or more vehicles per railcar, per the Association of American Railroads (AAR, 2023). A railcar that departs on time says nothing about the unit that waited for that car to fill.
Throughput measures fit that logic: units moved per period and units dwelling past standard. AIAG's scorecard measures capacity as vehicles shipped per week against vehicles expected per week, by location (AIAG, 2023). That is a throughput ratio. It does not care how many trucks it took.
The days are not abstract. Cox Automotive put US available new-vehicle inventory at 2.68 million units and 73 days' supply in August 2026. The average listing price was $49,486 (Cox Automotive, 2026). Every day a unit spends in the pipeline is a day it is not available to sell.
How do the European KPIs carry over to North America?
Most of the ECG and Odette KPIs carry over to North America, but the network they assume is different. The European set is built around plant-to-port flows and export voyages. US finished vehicle flows lean on rail, and the big US vehicle ports are mostly import gateways.
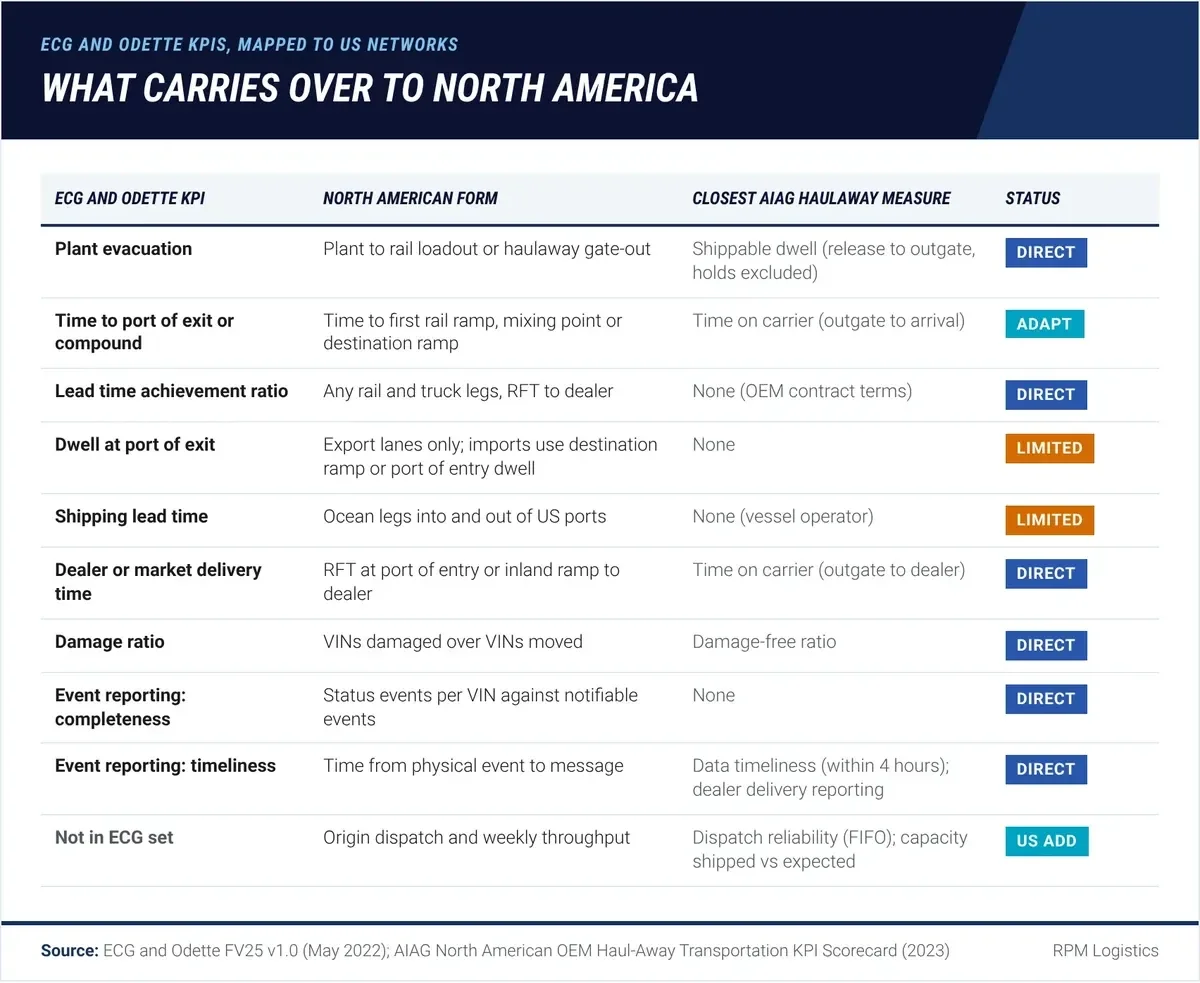
Port-of-exit KPIs matter for US exports. For imports, the working clock starts at RFT in the port of entry compound.
Rail moves nearly 75% of new US cars and light trucks (AAR, 2023). At the ports, Brunswick handled 779,000 vehicles in 2025, 79% of them imports. Baltimore handled more than 728,000, 83% imports (Automotive Logistics, 2026). Jacksonville handled 416,721 vehicles, 81% imports.
Here is how each standard KPI maps:
- Plant evacuation carries over directly. In the US, the stop event is rail loadout at the plant or haulaway gate-out.
- Time to port of exit or compound becomes time to the first rail ramp, mixing point or destination ramp. The node changes; the logic does not.
- Lead time achievement ratio carries over directly. It can span any combination of legs, which suits rail-plus-truck routings. Our breakdown of where rail beats truck on finished vehicle cost covers the mode choice behind those legs.
- Dwell at port of exit applies to US export lanes only. For the import-heavy ports, the closer analog is dwell at the destination ramp or the port of entry compound.
- Shipping lead time applies to import and export ocean legs. It measures the vessel operator.
- Dealer or market delivery time becomes a central US metric. Day 0 is RFT at the port of entry or the inland ramp. See how that leg runs in our guide to port-to-dealer finished vehicle logistics.
- Damage ratio and both event reporting KPIs carry over directly. AIAG has close equivalents for damage and reporting timeliness.
Port-side KPIs also need a plan for when the port itself is the constraint. Our analysis of port congestion and finished vehicle throughput covers triggers and contingency options.
What does the AIAG haulaway scorecard add?
AIAG's North American OEM Haul-Away Transportation KPI Scorecard is a carrier scorecard template for truck delivery to dealers. AIAG released it in 2023 alongside updated damage handling and connected vehicle documents. AIAG credits its 2023 to 2024 FVL documents to volunteer teams from Honda, Ford, General Motors, Nissan, Stellantis, Toyota, Volkswagen and others (AIAG, 2024).
The AIAG scorecard adds measures the European set lacks.
- Shippable dwell: time of outgate minus time of final release or tender, in hours, excluding any time on hold.
- Time on carrier: time of delivery to destination minus time of outgate.
- Dispatch reliability: share of vehicles shipped within the dispatch standard, first in, first out. The formula is 1 minus excess-aged units over total ground count. A separate version covers sold orders only.
- Capacity: vehicles shipped per week over vehicles expected per week, by location. Sub-haulers are the contracted carrier's responsibility.
- Data timeliness: milestone transmissions sent within 4 hours of the physical event, over total transmissions. AIAG notes this may vary by OEM contract.
- Claims settlement: share of claims paid within 60 days of assignment. The stated goal is 80% within 60 days, 90% within 90 and all within 120.
- Average claim cost: total claim value over VINs with claims, excluding disputed claims.
- Damage-free ratio: VINs damaged over VINs moved.
- Emissions: SmartWay grams per ton-mile for CO2, NOx and particulate matter, ranked 1 to 5.
The emissions rows are not a fringe idea. Carbon reduction was emerging as a vehicle logistics KPI in 2021, weighed against lead time and cost (Automotive Logistics, 2021).
The biggest difference is where the clock starts. The comparison below sets the two frameworks side by side on the concepts they share.
Concept | ECG and Odette (Europe) | AIAG haulaway scorecard (North America) | Contract consequence |
|---|---|---|---|
Origin dwell | Plant evacuation from RFT (Day 0) | Shippable dwell from final release or tender, holds excluded | The contract must say whether holds after RFT stop the clock |
Dispatch | Not separate | Share shipped within dispatch standard days, FIFO | Scores whether the oldest units ship first |
Throughput | Implied by plant evacuation | Weekly shipped versus expected, by location | Makes capacity a measured commitment |
Damage | Vehicles damaged per vehicles moved, provider-attributable | VINs damaged over VINs moved | Same structure; attribution rules decide the number |
Event data | Completeness and timeliness against agreed maximum | Transmission within 4 hours; dealer delivery on OEM timing | Data quality becomes a scored KPI |
Claims | Not covered | Settlement within 60 days; average claim cost | Claims speed scored alongside damage |
How should each KPI be defined: formula, events, data and owner?
A usable finished vehicle KPI definition names five things. These are the formula, the start event, the stop event, the record that proves each event, and the party that creates it. Leave any of the five open and two parties will report two different numbers from the same move.
The data sources are mostly status events. Carriers send pickup and delivery milestones by X12 EDI 214 shipment status messages or by API. Railroads report car location events.
Odette and ECG first published a full FVL message set in 2020. It now runs to 12 EDIFACT messages plus XML guides (Odette, 2023). They cover transport orders, vehicle status, damage and inventory reports.
AIAG's M-22 guideline supplies standard damage area and type codes. Its E-21 standard covers electronic proof of delivery to dealers.
The table below applies that frame to nine KPIs drawn from both standards.
KPI | Formula | Start event | Stop event | Data source | Event owner |
|---|---|---|---|---|---|
Plant evacuation or shippable dwell | Average of (outgate time minus RFT or release time), holds excluded if contracted | RFT or final release/tender | Gate-out or rail loadout | OEM release record; gate scan | OEM (start); compound or carrier (stop) |
Dispatch reliability | 1 minus (units over dispatch standard / ground count) | Release | Outgate | Yard inventory; gate scan | Compound operator |
Capacity attainment | Units shipped per week / units expected per week, by location | Week start | Week end | Tender plan; gate scans | OEM (plan); carrier (shipped) |
Time on carrier | Delivery time minus outgate time | Outgate | Arrival at destination | Carrier status messages | Carrier |
Lead time achievement ratio | Units delivered within contracted lead time / units delivered | RFT | Dealer arrival | RFT record; delivery receipt | OEM (start); carrier (stop) |
Dealer delivery time | Dealer arrival minus RFT at port of entry or ramp | RFT at port or ramp | Dealer arrival | Port or ramp release; proof of delivery | Port processor or railroad (start); carrier (stop) |
Damage ratio | VINs with attributable damage / VINs moved (percent or per 1,000) | Pickup inspection | Delivery inspection | Condition reports with standard damage codes | Carrier and receiving site |
Event reporting completeness | Events reported / notifiable events | Physical event | Message received | Status message log | Each party that reports |
Event reporting timeliness | Share of events reported within the agreed limit | Physical event | Message received | Message timestamps | Each party that reports |
Note the owner column. A KPI fails as a contract tool when the party scored does not control the start event. If the OEM sets RFT before a unit is actually releasable, the carrier inherits dwell it cannot touch. AIAG's scorecard starts at final release and excludes holds, which keeps that time off the carrier.
Where do finished vehicle KPI programs break down?
Finished vehicle KPI programs break down when the parties define events differently. The same move then produces different numbers. These are the failure points to write out of the contract:
- Holds counted as dwell. Quality, paperwork or recall holds inflate origin dwell unless the contract excludes them, as AIAG does.
- RFT set too early. If RFT is stamped at end of line rather than at release, plant evacuation measures the plant, not the provider.
- Trip-level on-time reporting. A truck can reach its last stop on time and still deliver its first unit late. It can also carry units that aged before dispatch.
- Damage without handoff inspection. Without inspections at each handoff, yard damage gets charged to the truck. Our guide to compound and yard management for finished vehicles covers that attribution gap.
- Thin event data from small carriers. Across US trucking, over 90% of for-hire companies run five or fewer trucks, per ATA data (Automotive Logistics, 2024). Event completeness depends on how status data gets collected from that fragmented base.
Targets come last. Neither standard publishes benchmark values, apart from AIAG's claims settlement goal. Set targets from your own baseline by lane and mode.
For realistic transit inputs, use our finished vehicle lead time benchmarks by lane and mode. When KPIs feed provider selection rather than ongoing management, the OEM logistics partner evaluation scorecard is the better tool.
Frequently Asked Questions
What are the 5 key KPIs in finished vehicle logistics?
No standard names an official top five. A practical core five from the 2022 ECG and Odette set is plant evacuation, lead time achievement, dealer delivery time, damage ratio and reporting timeliness. North American contracts can also use dispatch reliability and weekly capacity attainment from the AIAG haulaway scorecard. Both measure throughput at the origin compound.
What is plant evacuation in vehicle logistics?
Plant evacuation is the average time finished vehicles spend in the factory compound after they are Ready For Transport. ECG and Odette set RFT as Day 0 and stop the clock at collection. It is measured in days or hours against the contracted standard. AIAG's US equivalent, shippable dwell, starts at final release and excludes holds.
How is dwell time measured for finished vehicles?
Dwell time is measured per vehicle, from the event that makes a unit available to the event that moves it out. At origin that is RFT or final release to gate-out; at a port of exit, arrival to vessel departure. AIAG measures shippable dwell in hours and excludes time on hold. Report it per VIN, never per load or trip.
What KPIs are used in transportation for vehicle carriers?
AIAG's North American OEM Haul-Away Transportation KPI Scorecard gives the clearest public list. It covers shippable dwell, time on carrier, dispatch reliability, weekly capacity, data timeliness and dealer delivery reporting. It also scores damage-free ratio, claims settled within 60 days, average claim cost and SmartWay emissions rank. Each OEM sets its own targets in the contract.
Are there published benchmark values for FVL KPIs?
Very few. The ECG and Odette recommendation publishes no target values, so each KPI is measured against the contracted level. The AIAG haulaway scorecard leaves target columns blank for each OEM to fill. Its one published goal is claims settlement: 80% within 60 days, 90% within 90 and all within 120.
How do finished vehicle KPIs differ from fleet transport KPIs?
Finished vehicle KPIs measure new-vehicle flow from plant or port to dealer, with a focus on throughput, origin dwell and event data. Fleet transport KPIs measure moves for corporate and rental fleets. They focus on delivery windows, cost per road-ready vehicle and remarketing time. The vehicle is the unit in both, but the customer and clock differ.
Put standard KPI definitions into your next RFP
RPM arranges finished vehicle transport in all 50 states and Canada, handling booking, documentation, condition reporting and carrier coordination. If you are writing these KPIs into a new program, request an RFP from RPM's OEM logistics team.